Following the success of my finance tracking system (with spreadsheet and R), I became motivated to take on another life improvement project: time tracking. The goals here are similar: (1) no dependence on third-party service; (3) the system must be modular enough; and (3) it has a decent resolution to visualize how I spend my days.
First, we are going to take a quick look at my finance tracking project, known as Midas.
Midas Tracking
The current iteration of Midas is v3, which means this is the third year it has been running continuously since its inception. Before it became successful and adopted the name Midas, its humble beginning started by jotting down my expenses on Evernote, accompanied by aggressively collecting receipt for every purchase I made. It was a lengthy process & unsustainable.
When I was in Malaysia in summer 2017 prior to commencing my Ph.D. education in the States (this year I ran the prototypical v1), I revamped it and came up with a working spreadsheet layout. Now, it looks like this:

It is working and I like the appearance. However, this form is not ideal for visualization (with ggplot2 charting library in R). I took a step further by manually cleaning up the data, put the numbers into a different spreadsheet, which now can be fed into R without a messy data wrangling.
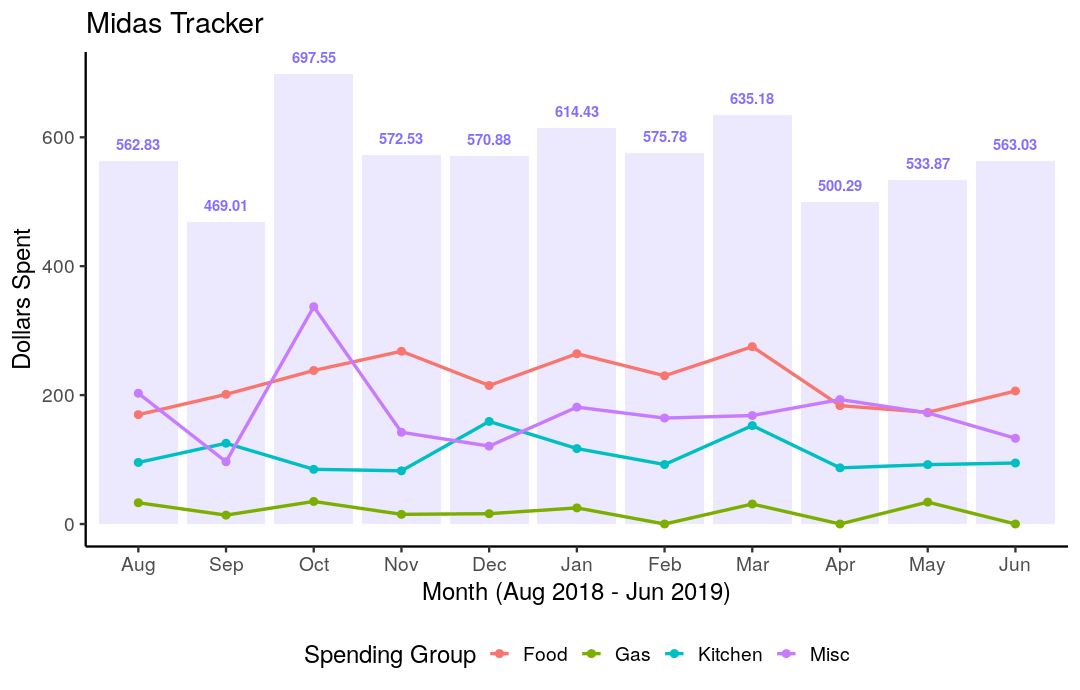
Here is the logic for Midas: compartmentalizing spending into two major categories: fixed spending, which refers to commitments that I have to meet every month and variable spending, which refers to voluntary spending that I can do each month, further broken down into a few sections.
Since the commitments will stay roughly the same every month, I am mostly interested on the variable spending. Data from variable spending is cleaned up first before being placed into a different spreadsheet to produce this visualization:
So far this setup has been successful. Of note, Midas v4 has been re-designed with a few notable improvements over the previous generations. Maybe I will write about that if I have some extra time.
time tracking
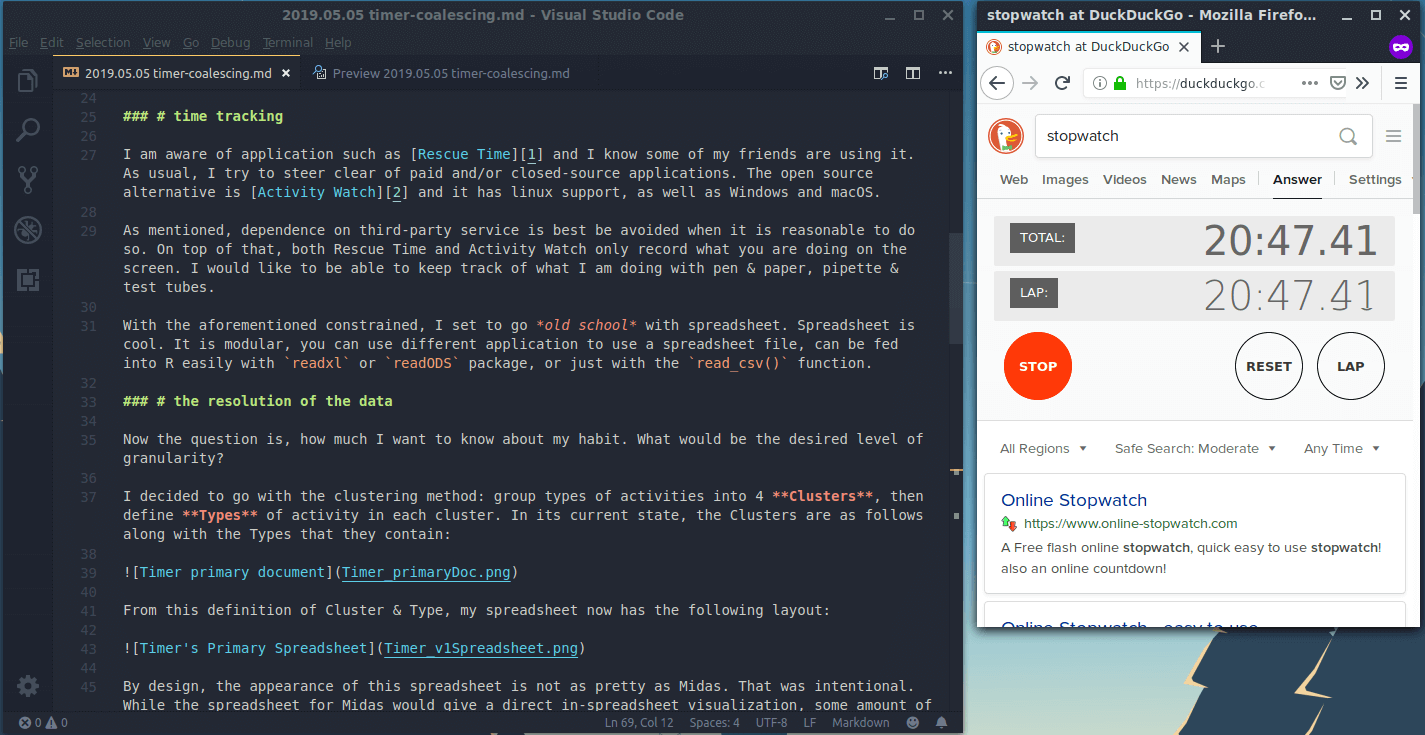
I am aware of application such as Rescue Time and I know some of my friends are using it. As usual, I try to steer clear of paid and/or closed-source applications. The open source alternative is Activity Watch and it has Linux support, as well as Windows and macOS.
As mentioned, dependence on third-party service is best be avoided when it is reasonable to do so. On top of that, both Rescue Time and Activity Watch only record what you are doing on the screen. I would like to be able to keep track of what I am doing with pen & paper, pipette & test tubes.
With the aforementioned constraints, I set to go old school with spreadsheet. Spreadsheet is cool. It is modular, you can use different application to use a spreadsheet file, can be fed into R easily with readxl or readODS package, or just with the read_csv() function.
the resolution of the data
Now the question is, how much I want to know about my habit. What would be the desired level of granularity?
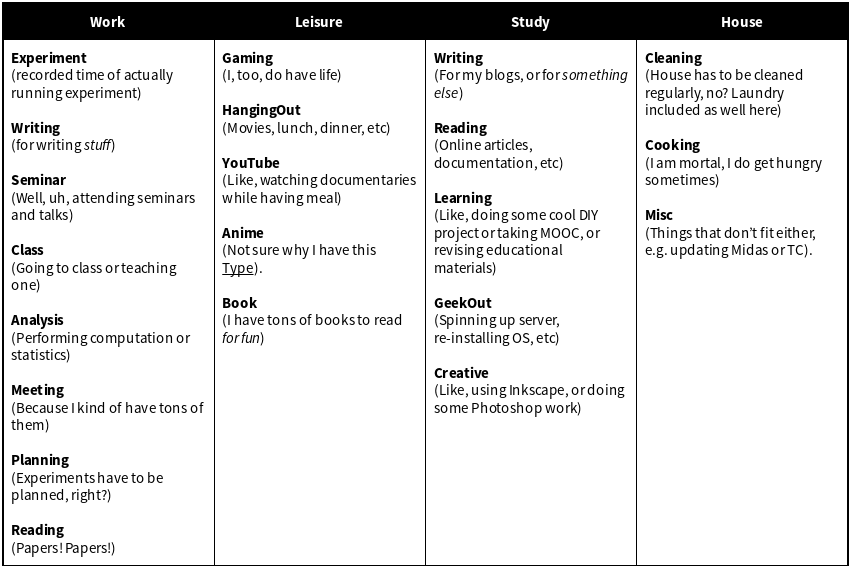
I decided to go with the clustering method: group types of activities into 4 Clusters, then define Types of activity in each cluster. In its current state, the Clusters are as follows along with the Types that they contain:
From this definition of Cluster & Type, my spreadsheet now has the following layout:
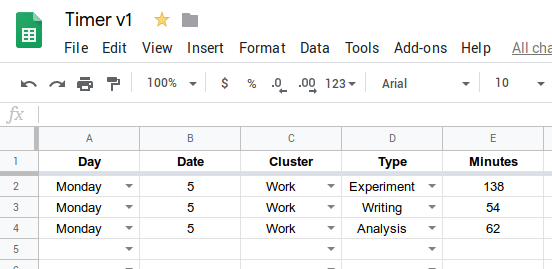
By design, the appearance of this spreadsheet is not as pretty as Midas. That was intentional. While the spreadsheet for Midas would give a direct in-spreadsheet visualization, some amount of work has to be done before making it ready for analysis and graphing in R. With the spreadsheet that I have for Timer, it is easier to feed the table into R and just focus on the analysis. Indeed, one could argue that intentional deficiency is an interesting design decision, sometimes it would yield a better result in the long term.
the analysis
Having run Timer for a while now, a question had come whimpered and begged for mercy: how efficient is it? So, let’s define the term “efficiency” here. In its simplest definition, how good was I at logging my time, or did I manage to record my time instead of the passage of time went through unnoticed?
To answer this question, we need to look at the first chart: logging efficiency, visualized by graphing hours logged for every single day. Let’s take a look at July 2019 until Sunday the 21st.
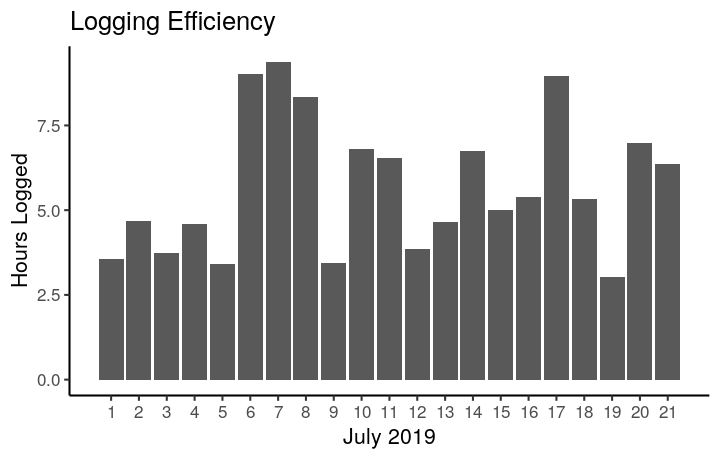
At a quick glance, logging efficiency could inform two things: (A) how good I am at keeping track of things that I am doing, and (2) how productive I am on a given day in a given month (which could be misleading, so see the next chart). This chart provides a general sense on the amount of hours I am occupied. But are these hours beneficial? The definition for beneficial here could be subjective; is it beneficial just for killing time, or is it beneficial with real purpose and goal?
To gain a better insight and to answer the question I put forward just now, the next analysis would be on how much time I spent in each cluster in July 2019. To look at this, the visualization here needs to show different color for each cluster.

Essentially the same chart as the previous one, but now it could answer more questions. Specifically, answering that beneficial or not question. Look at July 6 and 7, which were Saturday and Sunday. I logged more than seven hours on those two days. What did I do? Trying to finish some quests in Zelda: Breath of the Wild (Nintendo Switch), which bled a bit into Monday because I was testing some new weapons and new combat strategies. Eventually I slayed Thunderblight Ganon and finally freed the Divine Beast Vah Naboris, but man, it was so hard. In the weekdays, the dominant cluster tends to be the Work cluster, which makes sense.
Okay cool. That is a quite good resolution over there. But what about the time spent per type in any given cluster? To look at this aspect, I can do an intra-cluster analysis to see which activity in a given cluster I spent the most time.
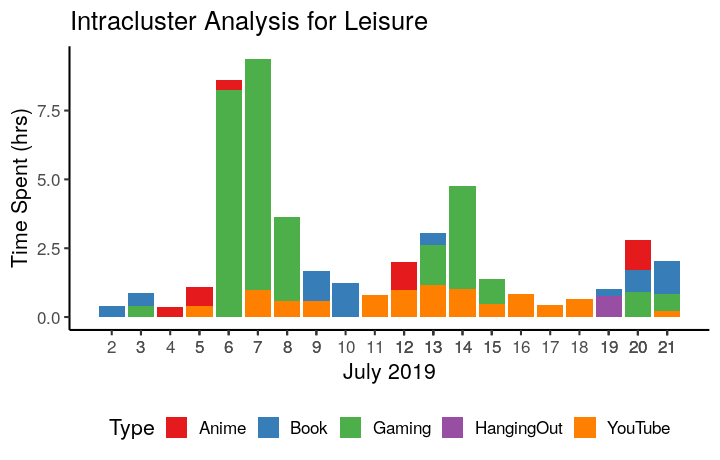
As an example for the intra-cluster analysis, I chose the Leisure cluster. Here you can see some improvements recently that I tried to spend less time watching YouTube (although mostly documentary of tech-related channels) to reading books. I am trying very hard right now to change my habit: read more, watch less, play less.
Now you may wonder: why is there no “Netflix” type. No, there is not. Why? That is because I don’t have a Netflix account. I do not want to get addicted to it. Netflix can be a time-sink. A damn good one.
rules
For any kind of technology, there has to be some abuse prevention system in place, right? The whole purpose of this time tracking project is to improve my daily habit, with the endpoint having me feeling contented by how much I have improved over the time. This would lend it the risk of me searching for self-validation by trying to find my way around this to make myself feel better, whatever that is.
Perhaps being the only rule, that is for an activity to be considered worthy of being recorded, I should be able to sustain myself doing it for a certain arbitrary length amount of time that would yield a net positive benefit. For example, a writing usually takes a block of 20 minutes to produce several paragraphs, hence a functional unit for a writing session is 20 minutes. This means to make a writing session worthy of being recorded, I should engage myself in that activity for at least 20 minutes. The rules are different for each type. Cleaning probably 5 - 10 minutes, cooking probably for 15 minutes. What’s preventing me from adhering to this rule is my willpower, and that will always be an issue. This is still a work in progress and soon I will talk more about it, if this post gets a sequel. Hopefully it will get one!!
closing words
Other than the success of Midas, what motivated me was Ramadan 2019. I have always been taught that Ramadan is a school of life and one should seek to better him/herself during this blessed fasting month. I had a long self-reflection moment 2 days before Ramadan, thinking what would be the next personal improvement project that I could embark for Ramadan 2019.
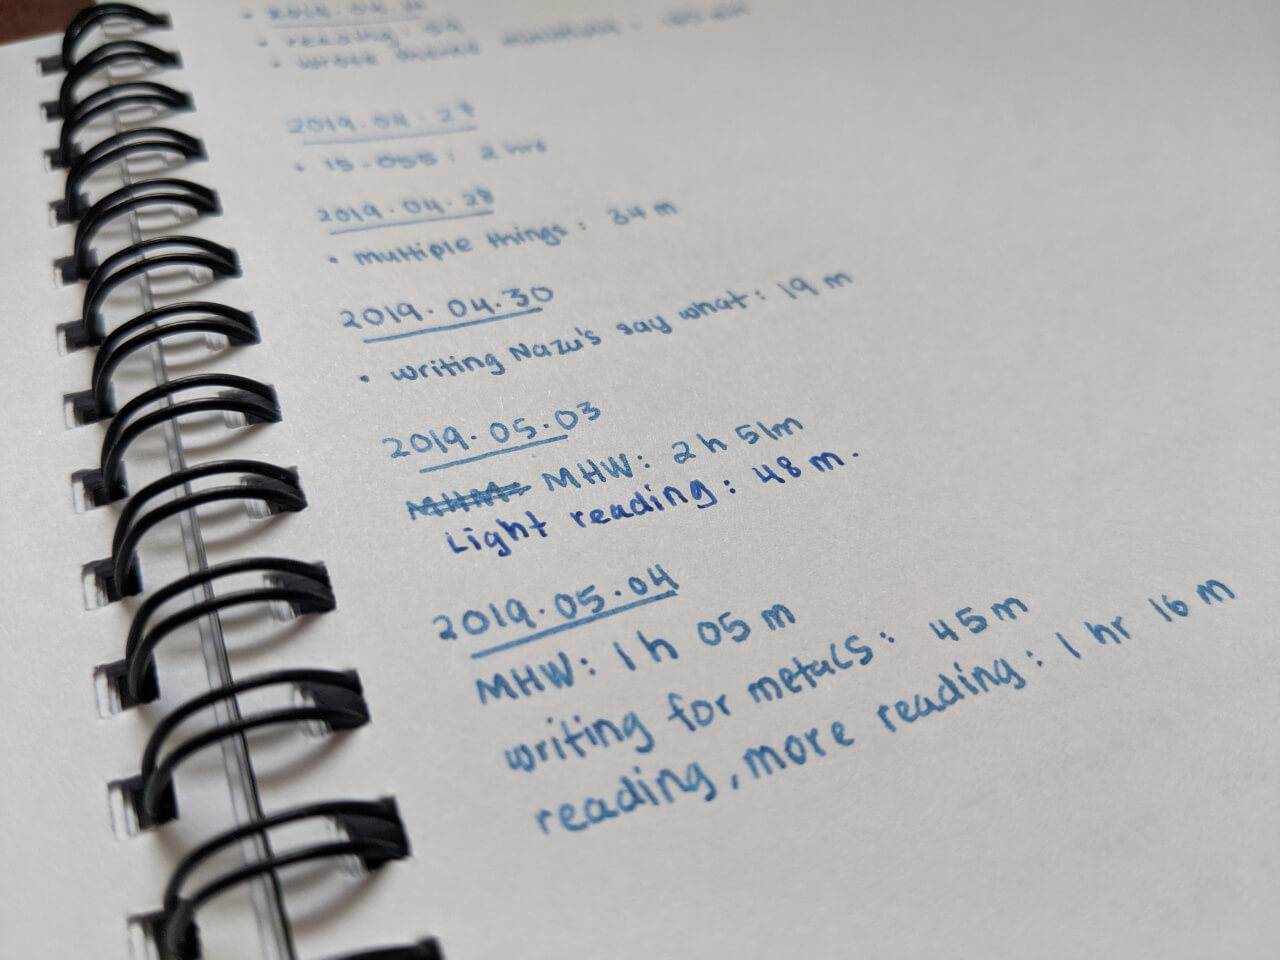
Before starting this project, I had already experimented with keeping notes on time spent for some activities. It ran from mid February 2019, and went on for 3 months. I thought to myself that maybe this (pen and paper) form was matured enough and ready to proceed into something more organized. As a side bonus, this would force me to be more mindful of what I am doing, how I am spending my time, and take some action to plan out how my day is going to be partitioned.
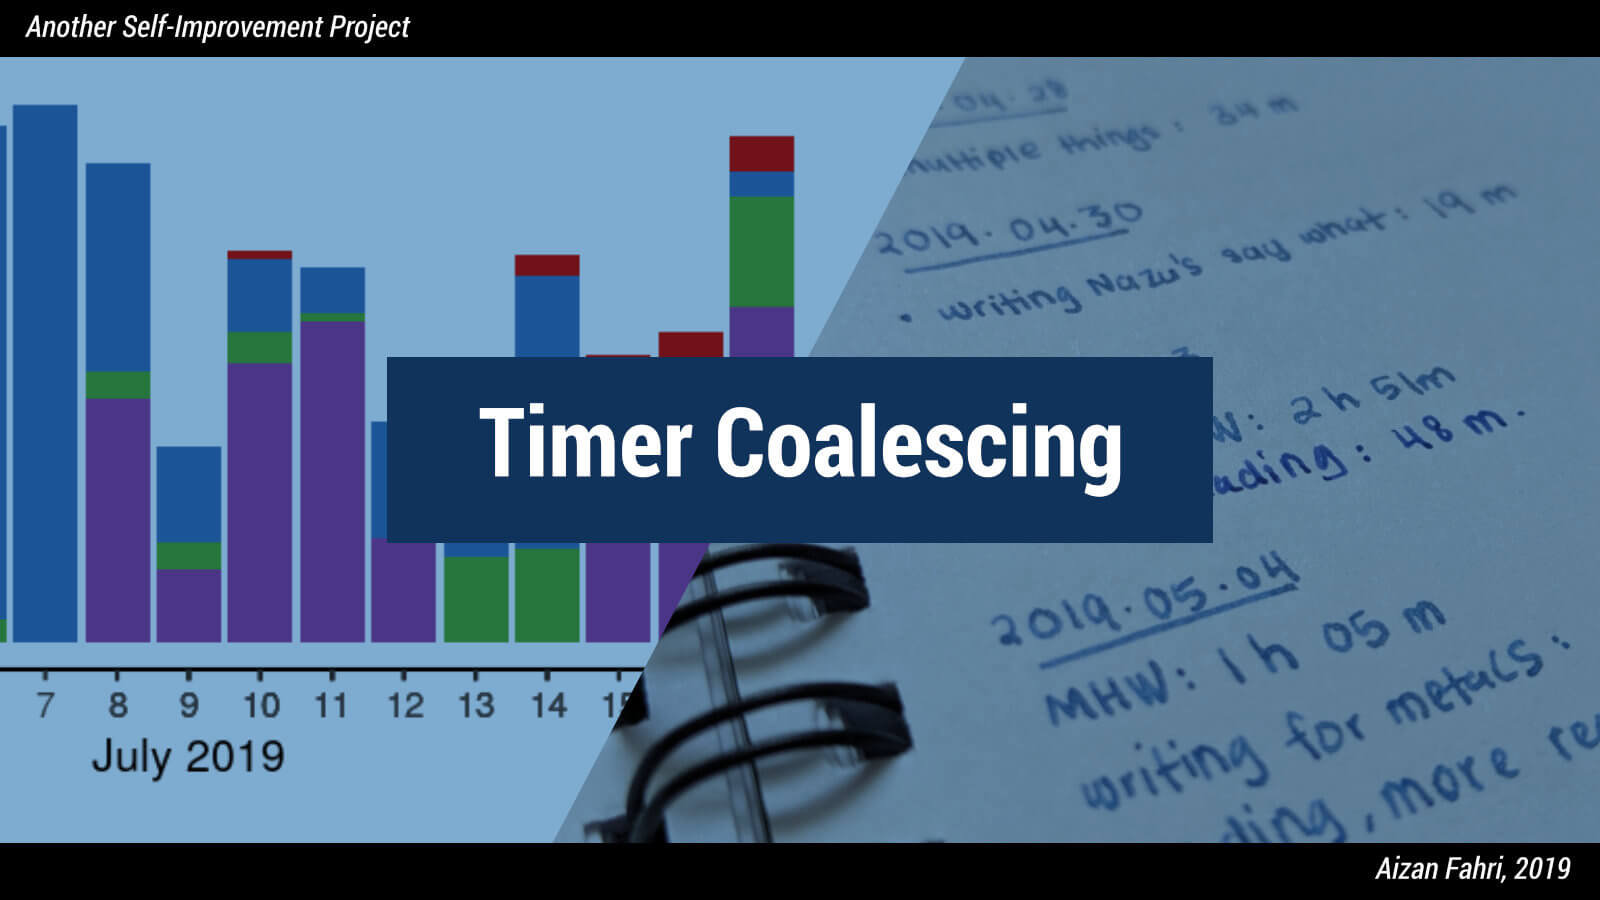
With that, I am going to christen this project a name: Timer Coalescing. Yes, the name is inspired from that Timer Coalescing.